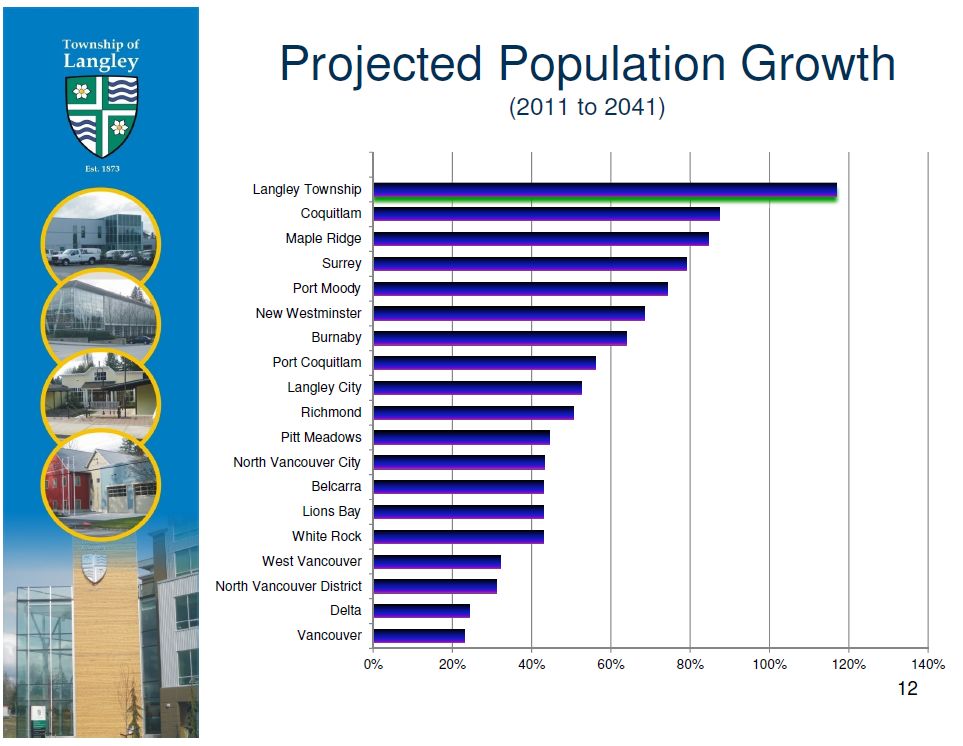
 Our friend Morgan Jensen, a candidate for city council in Maple Ridge, recently shared a chart that lays out growth forecasts for municipalities in Metro Vancouver. It comes from a planning presentation at the Township of Langley.
The chart shows more than a doubling of population in the Township, putting roughly 225,000 people in that area in 2041. The City of Vancouver would acquire the same number of people as the Township, but grow much more slowly in percentage terms, reaching a population of 765,000. Surrey would become the region’s largest city, with about 880,000 people.
The forecasts matter because they influence provincial and local government spending plans — a new hospital here, a new freeway there. And they play a part in local zoning decisions, such as (heh heh) a city council’s redefinition of green space as potential land for subdivision housing.
But I’m reminded of my post last week about Harrison Hot Springs, where the village’s 2007 official plan focuses on how to cope with ongoing growth. Since the plan was published, there has been zero population growth. In another B.C. small-town plan that I reviewed, the planners presented scenarios for 3%, 2% and 1% annual growth looking forward from 2006. The town has seen zero growth.
 There’s an industry built around population forecasting. An independent think tank, the U.S. Population Reference Bureau, has a staff of 48. However, there is a lot of room for debate about the methods that should be used. An extensive abstract of a study published in the journal Demography resides at US National Library of Medicine website. Researcher Guangqing Chi looked at 30 years worth of town and city population records from Wisconsin. He or she offers the ambitious reader about 60 different ways of chopping up the data to generate population forecasts, if you can cope with terms like “heteroskedacicity” and “coefficient drift”, the latter being a “major problem.”
To simplify, it seems a standard population forecast begins by establishing the age of the current population, measures long-term trends in birth rates, death rates and migration patterns, and boots the whole thing into the future. And voilà, a population figure for 2041.
Researcher Chi, probably like you or me, imagined it might make sense to predict local population numbers by examining local conditions. What does the town have that will attract people, or cause them to look elsewhere? Jobs, health and recreation services, housing, safe streets, transportation accessibility, air and water quality, character, access to nature, forward-looking leadership…? Under “natural amenities,” to take just one heading, Chi proposed five variables that may influence in- our out-migration: the proportion of forestry areas, the proportion of water areas, lengths of shoreline, total areas of golf courses [!], and “the proportion of areas with slope between 12.5% and 20%.
 It’s a fascinating discussion, but it’s too complex to implement. Different age groups, ethnic groups or consumer subcultures will react to each of these variables in different ways, and the selection of measures is subjective. We can’t predict how many people will move to Maple Ridge in 2035 to work at the college, because there is no college in Maple Ridge and its future existence is hypothetical.
A handbook from the State of Florida, published two years before Chi’s study, counsels local governments to forget the soft variables, partly for reasons of cost. The 20-year forecasts published in Florida in 1980, based on the back-to-the-future model, were off by an average of 17 per cent; but that’s good enough. The Florida handbook advises that forecasts for small places (Harrison) will be especially unreliable, as will forecasts for fast-growing areas at the urban fringe (Township of Langley).
Of course, if we see a new era of social instability — radical changes to Canada’s immigration system, or a collapse in housing prices — the average forecasting inaccuracy may exceed 17 per cent. The application of a single urban planning system on all of Metro Vancouver’s areas might also have interesting effects on the distribution of population growth around the region, and on the numbers shown in the chart at the top of this post.
At the provincial level, BC Stats currently offers this caveat on its predictions:
“BC Stats applies the Component/Cohort-Survival method to project the population. This method “grows” the population from the latest base year estimate by forecasting births, deaths and migration by age. These forecasts are based on past trends modified to account for possible future changes and, consequently, should be viewed as only one possible scenario of future population.”

