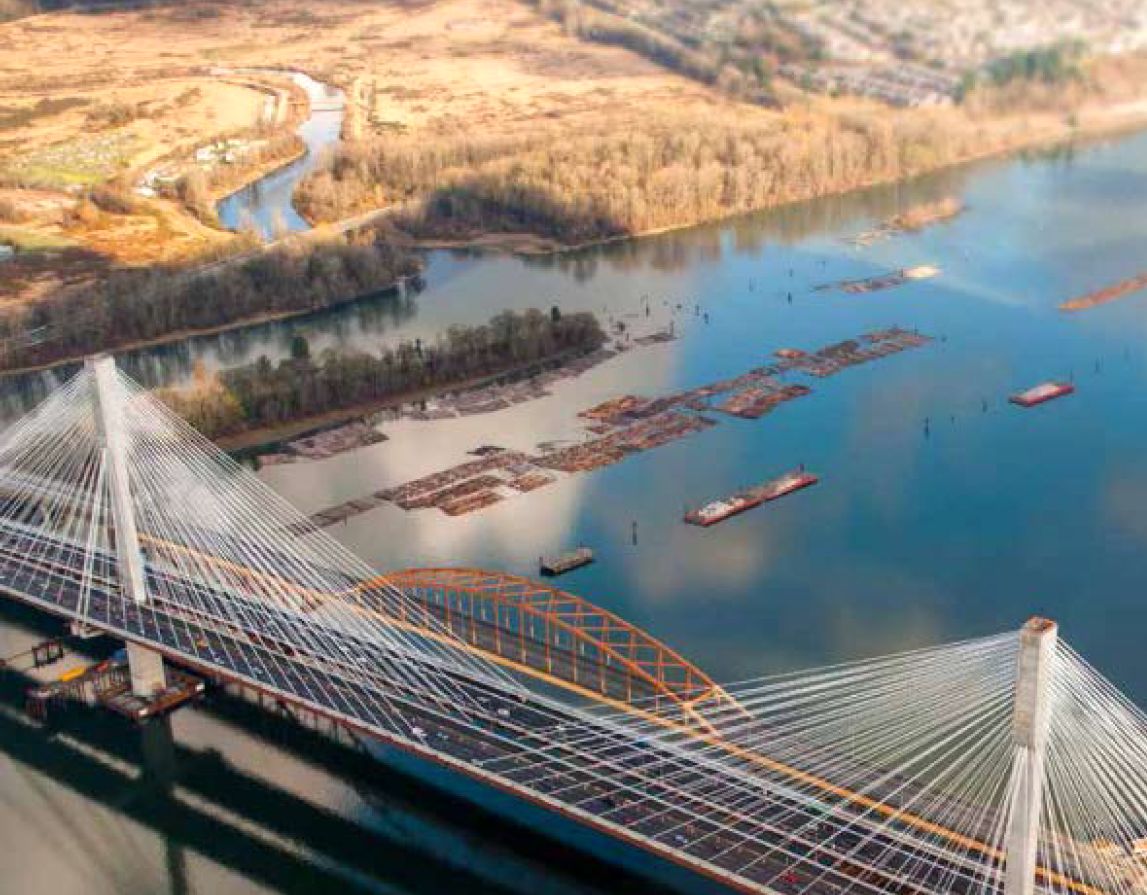
Part of the Port Mann Bridge; graphic from the current TI Corp service plan
The British Columbia government now predicts heavier short-term financial losses on the Port Mann toll bridge than previously forecast, although it maintains the position that user tolls will eventually pay all costs related to the reconstructed bridge.
The issue here is declining traffic volumes — a pattern of decline that began long before tolls were implemented in 2012. Weekday traffic on the bridge, the primary access point to Vancouver from the rest of Canada, is down an astonishing 20 per cent from the peak levels of 2006.
Credit for pointing out these and related numbers goes to Nathan Pachal and his South Fraser Blog, and to the folks who operate the government’s remarkably detailed Traffic Data site.
As noted earlier on Fraseropolis.com, the 2012 service plan of the Transportation Investment Corporation forecast that, with growing revenues, the $3.3 billion Port Mann Bridge/Highway 1 project would start paying its way in 2017. The net loss for 2014 was forecast at $28.3 million.
The 2014 service plan tells a different story. The target net loss for 2014 is now $79 million, with essentially the same losses forecast for 2015 and 2016. The plan reassures us (page 16) that this is manageable, and TI Corp is “on track to meet all financial obligations by 2050.”
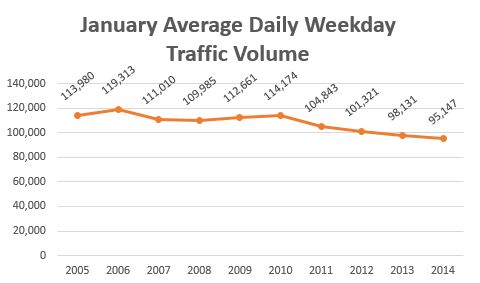
Port Mann weekday traffic volumes, 2004-2014, compiled from MoT and TI Corp reports by South Fraser Blog
As the South Fraser Blog points out, per-capita vehicle use has been declining across North America for several years. This point is reinforced, unscientifically, by a random scan of B.C. traffic data presented below.
Even against this background, the Port Mann Bridge is an outlier in terms of its steeply declining traffic levels. It saw a 15 per cent decline in January weekday use from 2006 to early 2012, before any tolls were imposed. After 2009, the new Golden Ears crossing east of the Port Mann offered a better route to some destinations. There may be anxious drivers who avoided the Port Mann and its approaches during a long construction period. And the Metro Vancouver region’s rising fuel taxes have provided an increasing disincentive against optional vehicle trips.
The tolls on the new Port Mann crossing, which were phased in starting in December 2012, have become a further significant deterrent to use. The South Fraser blog reports that traffic at the untolled Pattullo crossing, downstream, increased by 10,000 cars per day from late 2012 to January 2014. It’s possible that all of this, on a net basis, is made up of people fleeing the Port Mann tolls. Net weekday crossings of the Port Mann have dropped by perhaps 4,000 in this period, suggesting that TI Corp has attracted some replacement drivers to the newer, faster bridge.
Below is a brief attempt to put the Port Mann numbers in context. The numbers are taken from the provincial website, and the Pattullo Bridge is a regional asset, so it is not included here. If anyone finds a sample set that points in a different direction, let us know. The population of British Columbia grew by 8.1% from early 2006 to early 2013.

The average January weekday decline in traffic at the Port Mann from 2006 to 2014 was 20.3%. This is derived by combining Traffic Data site figures and a recent TI Corp report.
Given the pressure on the Pattullo Bridge, and the widespread resentment against the Port Mann tolls in the South-of-Fraser cities, Surrey Mayor Dianne Watts and others including Nathan Pachal have advocated for more evenly distributed, region-wide bridge tolling or road pricing. At best, it will be years before these proposals bear any fruit. The effects on Port Mann traffic and the Port Mann financial picture are unknowable.
I’ll disclose that I worked as a contract editor for one draft of the long internal justification of the Port Mann project — one of how many drafts, I don’t know. It was not anticipated then, in about 2002, that traffic volumes would slump as they have.

Pingback: Port Mann: The Rise of a Bridge and the Fall of its Use | Price Tags
Thanks for the numbers and breakdown. It would be interesting to know how population has shifted over this same time. My understanding is that South of Fraser is the fastest growing region in Metro Vancouver (or even in all of BC?). And so this makes the decline in traffic even more surprising.
I agree, Andrew. The City of Surrey population page (http://www.surrey.ca/business-economic-development/1418.aspx) shows a 25% population growth for that municipality over 10 years from 2003 to 2013. Earlier on Fraseropolis (March 9, 2012) I noted the rapid growth in employment numbers in Surrey; I expect this trend is also continuing.